RSS

My First Home - Lanny McDonald

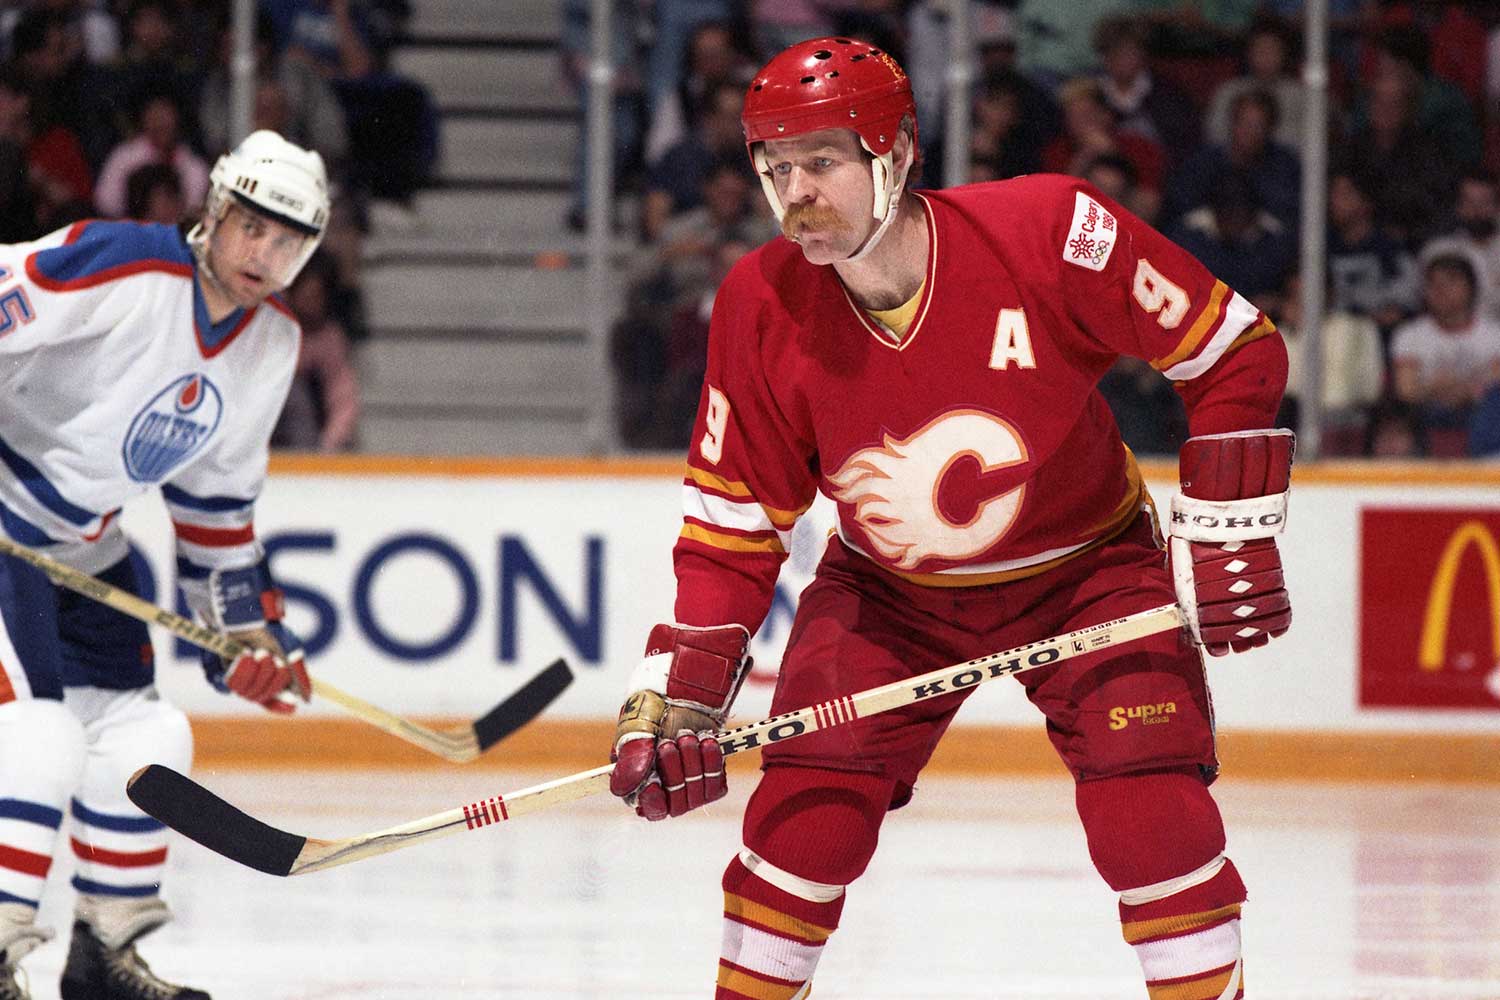
Iconic status was off in the future for the 22-year-old winger. The bushy moustache had yet to grow out and become a trademark.


“We bought our first home year three in Toronto,” said Lanny McDonald, reminiscing. “We’d just gotten married. The house was out in Port Credit. Mineola Street, I believe. A bungalow that had a bonus room up above the garage and it was the scariest thing in the world. Oh my gosh. I think it cost $125,000. We were making a good living, certainly no complaints, but buying a first house is frightening. Luckily, it turned out to be absolutely awesome."


“Darryl (Sittler) lived just down the way, on Mississauga Road. Wendy (Sittler) and (my wife) Ardell became great friends. Darryl and I would drive into the games and practices together. We had a great time in that first house. But that commitment … signing your name? Oh my God!”


For McDonald – the Hockey Hall of Famer and 1989 Stanley Cup champion whose iconic No. 9 was retired by the Calgary Flames in 1990 – his number-one priority in a home never changes.


“For me, it has to have the biggest kitchen and family room, attached if possible, because that’s where everyone spends the bulk of their time,” he said. “You’re hanging out over the kitchen counter with the kids. Enjoying a few drinks with friends. There’s laughter, there's conversation. The family room/kitchen area is the hub.”


The McDonalds have owned homes at four different addresses. “We purchased two houses in Toronto,’’ he said, “then we go to Colorado and rent the first year-and-a-half. So I talk with the owners, looking for a little security lifestyle-wise, and they say, ‘You’re not going anywhere. You’re here for life.’ Great. We buy a new house out in a new area and, you guessed it, I’m traded to the Flames two-and-a-half months later! We hadn’t even finished the yard.”


Since arriving in Calgary in November 1982, the family has resided in Springbank, renovating their property four times rather than packing up to relocate.


“It’s been fabulous,” he said. “All our kids went though the school system in the area. The boys played hockey. And now our grandkids have moved back from Montana and they’re attending Springbank and The Edge. Talk about coming full circle.”


Through the intervening years, an older McDonald, now chairman of the Hockey Hall of Fame, has occasionally returned to his residential roots on Mineola Street.


“They’ve bulldozed all the houses there and built mansions,’’ he said, laughing. “I wish we still had the lot because you’re probably talking about $2-to-$2.5-million homes now. I mean, $125,000 sure won’t buy you much there today.”

Read

Secondary Suites

Secondary suites make homeownership more affordable for cash-strapped buyers

Homes with secondary suites have been a hot topic in Calgary for years, but their appeal for homebuyers looking to generate extra revenue is only growing amid adverse economic conditions.


It is important to find out whether the secondary suite in a home is legal before making any purchase, which can be done by going to the City of Calgary’s website, www.calgary.ca/suites.

If a suite is illegal and a neighbour complains about noise or parking from a tenant, then a bylaw officer can come out and shut you down, meaning you’d have to tell your tenants to leave.


The best place to buy a home with a suite is typically near large employment centres, such as commercial or industrial areas, hospitals, universities, or downtown, as these are the areas where tenants want to live.


When it comes to homeowner demographics, baby boomers or other empty nesters like the rental income a secondary suite can provide, while younger homebuyers often use the added income to be able to buy a home in the first place.

Read

January Market Update


The improvement of the Calgary housing market continued in December with further stability capping off a stronger second half of the year.

New figures from the Calgary Real Estate Board show that activity returned to levels close to those seen in the past five years with annual sales up 1%.

“Price declines, lower mortgage rates and some modest improvements in full-time employment helped support some demand growth in the city. Reductions in supply are also contributing to the slow adjustment to more stable conditions in the housing market,” said CREB® chief economist Ann-Marie Lurie.

Annually, the attached homes segment was the star performer with sales up by nearly 7% for a total of 3,780 sales. Apartments just outpaced year-ago levels with 2,672 units sold, while detached sales were broadly in line with those of a year earlier.

Price pressures
Overall prices in 2019 declined by 3% year-over-year, marking a 10% decline since the 2014 slowdown in the energy sector.

“As oversupply in the market continues to ease, we should start to see more stabilization in prices. However, conditions continue to favour the buyer and this is weighing on prices,” added Lurie.

For December, attached sales were up 14% to 220, apartments gained 27.6% to 134 sales, and detached sales increased 1.6% to 504.

December’s unadjusted benchmark prices were $418,500, just slightly lower than November and 1% below last year’s levels.

Detached benchmark prices were $480,100 in December contributing to the 2019 average of $484,808, three per cent below last year’s levels.

December semi-detached prices were $388,200 and row prices were $283,000. Both segments saw annual price declines in excess of three per cent and remain well below previous highs.

 
Read

The 10 Most Expensive Communities in SW Calgary


These are the 10 most expensive Calgary communities in the southwest quadrant, based on year-to-date (YTD) residential average sale price.


1. Bel Aire
Established: 1960
Population: 390
Dwellings: 159
Median pre-tax household income: $401,839
New listings (YTD): 20
Number of residential sales (YTD): 4
Residential average sale price (YTD): $2,000,000
Residential benchmark price (YTD): N/A


2. Britannia
Established: 1956
Population: 690
Dwellings: 313
Median pre-tax household income: $268,603
New listings (YTD): 40
Number of residential sales (YTD): 19
Residential average sale price (YTD): $1,807,237
Residential benchmark price (YTD): $1,342,380


3. Bayview
Established: 1967
Population: 751
Dwellings: 248
Median pre-tax household income: $260,339
New listings (YTD): 22
Number of residential sales (YTD): 9
Residential average sale price (YTD): $1,613,722
Residential benchmark price (YTD): $939,800


4. Elbow Park
Established: 1910
Population: 3,342
Dwellings: 1,195
Median pre-tax household income: $296,866
New listings (YTD): 112
Number of residential sales (YTD): 51
Residential average sale price (YTD): $1,506,287
Residential benchmark price (YTD): N/A


5. Roxboro
Established: 1923
Population: 422
Dwellings: 154
Median pre-tax household income: $565,835
New listings (YTD): 7
Number of residential sales (YTD): 3
Residential average sale price (YTD): $1,476,667
Residential benchmark price (YTD): N/A


6. Upper Mount Royal
Established: 1904
Population: 2,478
Dwellings: 1,070
Median pre-tax household income: $214,282
New listings (YTD): 89
Number of residential sales (YTD): 27
Residential average sale price (YTD): $1,401,889
Residential benchmark price (YTD): N/A


7. Mayfair
Established: 1957
Population: 432
Dwellings: 156
Median pre-tax household income: $307,108
New listings (YTD): 7
Number of residential sales (YTD): 2
Residential average sale price (YTD): $1,190,000
Residential benchmark price (YTD): N/A


8. Elboya
Established: 1947
Population: 1,754
Dwellings: 771
Median pre-tax household income: $106,887
New listings (YTD): 38
Number of residential sales (YTD): 8
Residential average sale price (YTD): $1,142,250
Residential benchmark price (YTD): $815,720


9. Pump Hill
Established: 1967
Population: 1,640
Dwellings: 562
Median pre-tax household income: $165,266
New listings (YTD): 32
Number of residential sales (YTD): 16
Residential average sale price (YTD): $941,344
Residential benchmark price (YTD): $851,730


10. Scarboro
Established: 1910
Population: 931
Dwellings: 339
Median pre-tax household income: $220,777
New listings (YTD): 17
Number of residential sales (YTD): 10
Residential average sale price (YTD): $890,448
Residential benchmark price (YTD): N/A

Read
Data is supplied by Pillar 9™ MLS® System. Pillar 9™ is the owner of the copyright in its MLS®System. Data is deemed reliable but is not guaranteed accurate by Pillar 9™.
The trademarks MLS®, Multiple Listing Service® and the associated logos are owned by The Canadian Real Estate Association (CREA) and identify the quality of services provided by real estate professionals who are members of CREA. Used under license.